phyloMOD.pl has a graphical output: a vector graphic picture
depicted with Grace
tool.
Follows an example:
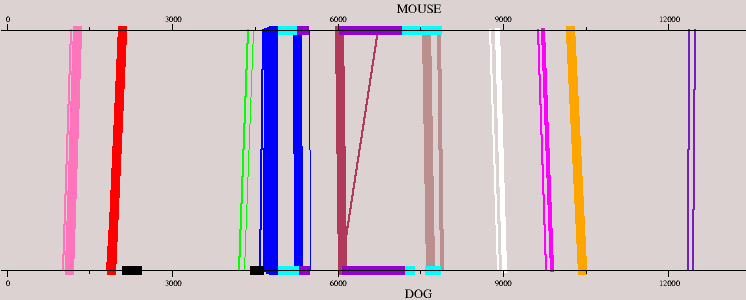
Graphical output of a pairwise comparison between mouse
and dog orthologous sequences, Sp5 gene and 5kb upstream and downstream
it. Top axis represents mouse DNA, while bottom axis represents dog DNA.
Gene has been depicted in each axis in the following way: cyan stands
for UTR region and violet stands for exonic region (this information is
provided with annotation files). Gaps, present in dog DNA, are depicted
with black stripes on the corresponding axis.
Corresponding modules are connected by lines. Each line corresponds to
a hit. Hits in the same module have the same color.
Zooming the picture on the pink and red module:

We can notice each module is composed by two hits, one
of which is very strong: thicker is the line stronger is the hit.
Both are likely modules. Thicker hits are likely to contain more than
one binding site. For this reason even single hits may constitute a
"module": it has to be at least 50bp long.